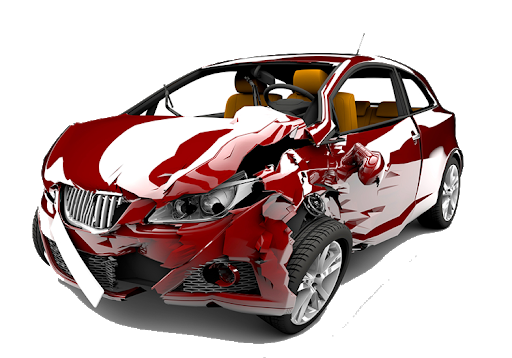
This image has format transparent PNG with resolution 512x358.
You can download this image in best resolution from this page and use it for design and web design.
Car crash PNG with transparent background you can download for free, just click on download button.
A traffic collision, also called a motor vehicle collision, car accident, or car crash, occurs when a vehicle collides with another vehicle, pedestrian, animal, road debris, or other stationary obstruction, such as a tree, pole or building. Traffic collisions often result in injury, disability, death, and property damage as well as financial costs to both society and the individuals involved. Road transport is the most dangerous situation people deal with on a daily basis, but casualty figures from such incidents attract less media attention than other, less frequent types of tragedy.
A number of factors contribute to the risk of collisions, including vehicle design, speed of operation, road design, weather, road environment, driving skills, impairment due to alcohol or drugs, and behavior, notably aggressive driving, distracted driving, speeding and street racing.
In 2013, 54 million people worldwide sustained injuries from traffic collisions. This resulted in 1.4 million deaths in 2013, up from 1.1 million deaths in 1990. About 68,000 of these occurred in children less than five years old. Almost all high-income countries have decreasing death rates, while the majority of low-income countries have increasing death rates due to traffic collisions. Middle-income countries have the highest rate with 20 deaths per 100,000 inhabitants, accounting for 80% of all road fatalities with 52% of all vehicles. While the death rate in Africa is the highest (24.1 per 100,000 inhabitants), the lowest rate is to be found in Europe (10.3 per 100,000 inhabitants).A number of physical injuries can commonly result from the blunt force trauma caused by a collision, ranging from bruising and contusions to catastrophic physical injury (e.g., paralysis) or death.
Following collisions, long-lasting psychological trauma may occur. These issues may make those who have been in a crash afraid to drive again. In some cases, the psychological trauma may affect individuals' life can cause difficulty to go to work, attend school, or perform family responsibilities.
The safety performance of roadways is almost always reported as a rate. That is, some measure of harm (deaths, injuries, or number of crashes) divided by some measure of exposure to the risk of this harm. Rates are used so the safety performance of different locations can be compared, and to prioritize safety improvements.
Common rates related to road traffic fatalities include the number of deaths per capita, per registered vehicle, per licensed driver, or per vehicle mile or kilometer traveled. Simple counts are almost never used. The annual count of fatalities is a rate, namely, the number of fatalities per year.
There is no one rate that is superior to others in any general sense. The rate to be selected depends on the question being asked – and often also on what data are available. What is important is to specify exactly what rate is measured and how it relates to the problem being addressed. Some agencies concentrate on crashes per total vehicle distance traveled. Others combine rates. The U.S. state of Iowa, for example, selects high collision locations based on a combination of crashes per million miles traveled, crashes per mile per year, and value loss (crash severity).
In this page you can download free PNG clipart: Car crash PNG images free download